Wondering whether a hybrid car is worth the extra upfront cost? This hybrid car savings calculator estimates how much you could save on fuel each year, how quickly the hybrid pays for itself, and your total net savings over your ownership period. Simply enter your current vehicle’s fuel economy, your expected hybrid’s fuel economy, how much you drive, and local fuel prices to get a clear, data-driven picture of your potential hybrid car savings — including the impact of tax credits, maintenance savings, and rising fuel prices over time.
Hybrid Car Savings Calculator: Fuel Cost & Break-Even Estimator
Calculate annual fuel savings, break-even period, and total net savings when switching from a conventional car to a hybrid vehicle.
How to Use This Calculator

Follow these steps to get your personalized hybrid savings estimate:
- Enter your current vehicle’s MPG — check your owner’s manual, window sticker, or fueleconomy.gov for your car’s combined fuel economy rating.
- Enter the hybrid’s MPG — use the EPA combined rating for the hybrid model you are considering, typically found on the window sticker or manufacturer website.
- Set your annual miles driven — use your odometer readings from the past year, or estimate based on your typical weekly driving.
- Enter the current gasoline price per gallon — use your local pump price or a recent average for your region.
- Enter the hybrid price premium — this is the extra cost of the hybrid compared to a similar conventional vehicle, not the full purchase price.
- Set your planned ownership period using the slider — longer ownership periods generally favor the hybrid financially.
- Adjust the annual fuel price increase — a modest 2–3% reflects historical averages; set to 0% for a conservative flat-price estimate.
- Add any annual maintenance savings — hybrids typically need fewer oil changes and experience less brake wear due to regenerative braking.
- Enter any available tax credit or incentive — federal, state, or local incentives reduce your effective price premium and shorten break-even time.
- Review your results — the calculator instantly shows annual fuel costs, year-one savings, break-even period, and total net savings.
Understanding the Calculator Inputs
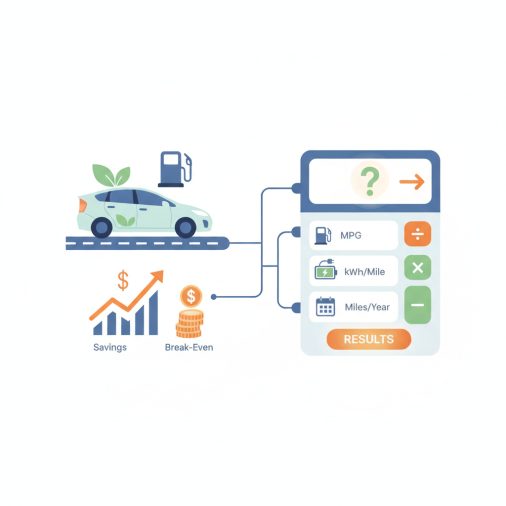
Current Vehicle Fuel Economy (MPG): Enter the combined city/highway miles-per-gallon rating for the vehicle you currently drive or plan to replace. You can find this on your window sticker, in your owner’s manual, or at fueleconomy.gov. The default of 28 MPG reflects a typical mid-size sedan. If you drive a larger SUV or truck, your figure may be lower (15–22 MPG); a compact car may be higher (32–38 MPG). Using a realistic real-world figure rather than the EPA best-case number will give you a more accurate savings estimate.
Hybrid Vehicle Fuel Economy (MPG): Enter the combined MPG rating for the hybrid you are considering. Popular hybrids range from about 42 MPG (Toyota Camry Hybrid) to 57 MPG (Toyota Prius). The default of 50 MPG is a reasonable mid-range estimate. Note that hybrids often perform better than their EPA rating in city driving due to regenerative braking, but may perform closer to or slightly below the rating on long highway trips.
Annual Miles Driven: Enter the total miles you drive in a typical year. The U.S. average is approximately 13,500 miles per year, but your actual figure may vary significantly. Higher annual mileage amplifies savings — drivers who commute long distances benefit most from a hybrid’s fuel efficiency advantage.
Gasoline Price per Gallon: Enter the current price you pay at the pump for regular unleaded gasoline. Prices vary by region and season. Using a slightly higher-than-current price can provide a conservative buffer for future price increases, which are modeled separately by the fuel price increase field.
Hybrid Purchase Price Premium: This is the additional cost of the hybrid compared to a comparable conventional vehicle — not the full sticker price. For example, if a Toyota Camry Hybrid costs $31,000 and the standard Camry costs $27,000, the premium is $4,000. Research current model-year pricing to get an accurate figure. A lower premium shortens your break-even period significantly.
Planned Ownership Period (Years): Use the slider to set how many years you plan to keep the vehicle. The longer you own the hybrid, the more cumulative savings you accumulate. Most financial analyses suggest hybrids become clearly advantageous beyond 4–6 years of ownership for average drivers.
Annual Fuel Price Increase (%): This models the expected yearly rise in gasoline prices as a compound growth rate. Historically, U.S. gasoline prices have increased at roughly 2–3% per year on average, though with significant volatility. Setting this to 0% gives a flat-price conservative estimate; setting it to 3–4% reflects a moderate inflation scenario that increases your projected savings over time.
Annual Hybrid Maintenance Savings: Hybrids typically require fewer oil changes (some use synthetic oil with longer intervals), and regenerative braking significantly reduces brake pad and rotor wear. Estimates of $150–$400 per year are commonly cited, though actual savings depend on your vehicle model, driving habits, and local labor rates. Set to $0 if you prefer a fuel-only savings estimate.
Available Tax Credit or Incentive: Enter the total dollar value of any federal, state, or local incentives you qualify for. As of 2024, the U.S. federal tax credit for new clean vehicles under the Inflation Reduction Act can be up to $7,500 for eligible vehicles, though standard non-plug-in hybrids generally do not qualify for the federal EV credit — check IRS.gov and your state’s energy office for current eligibility. This field reduces your effective price premium and shortens break-even time.
Understanding Your Results
Annual Fuel Cost — Current Vehicle: This is how much you currently spend on gasoline each year based on your mileage, fuel economy, and the price per gallon you entered. It serves as your baseline cost before switching to a hybrid.
Annual Fuel Cost — Hybrid Vehicle: This is the projected annual gasoline cost if you drove the same miles in the hybrid. The difference between this figure and your current annual fuel cost is your raw annual fuel saving.
Year-1 Net Annual Savings: This combines your first-year fuel savings with your estimated annual maintenance savings. It represents the total annual financial benefit of owning the hybrid before accounting for the purchase price premium. This is the figure used to calculate your break-even period.
Effective Price Premium (After Incentives): This is the net extra amount you pay for the hybrid after subtracting any tax credits or incentives. If your incentives exceed the price premium, this result shows $0.00, meaning the hybrid costs no more than the conventional vehicle upfront — a very favorable scenario.
Break-Even Period: This tells you how many years it takes for your cumulative annual savings to fully recover the effective price premium. A break-even period shorter than your planned ownership period means the hybrid will save you money overall. This calculation uses flat Year-1 savings; the total net savings result uses compound escalation for a more accurate long-term picture.
Total Net Savings Over Ownership Period: This is the bottom-line financial result — the total money you save (or lose) over your full ownership period after accounting for escalating fuel prices and subtracting the effective price premium. A positive number means the hybrid saves you money overall. A negative number means the price premium has not yet been recovered within your ownership window.
Calculation Formulas Explained
Annual Fuel Cost Formula: Fuel cost equals miles driven divided by fuel economy (MPG), which gives gallons consumed, multiplied by the price per gallon. For example: (annual_miles / current_mpg) * fuel_price. The same formula applies to the hybrid using hybrid_mpg.
Year-1 Net Annual Savings Formula: The annual fuel saving is the difference between the two fuel costs above. Adding the annual maintenance savings gives the total Year-1 benefit: ((annual_miles / current_mpg) * fuel_price) – ((annual_miles / hybrid_mpg) * fuel_price) + hybrid_maintenance_savings.
Effective Price Premium Formula: The net upfront cost is the purchase price premium minus any tax credits, floored at zero to avoid negative values: max(0, price_premium – tax_credit).
Break-Even Period Formula: Break-even equals the effective price premium divided by the Year-1 net annual savings: max(0, price_premium – tax_credit) / Year-1 savings. This assumes savings are constant at Year-1 levels, which is a simplification — actual savings grow if fuel prices rise.
Total Net Savings Formula: To model escalating fuel prices, the calculator uses a geometric series sum. If annual savings in Year 1 are S and the fuel price grows at rate r per year for n years, the cumulative savings equal S * ((1 + r)^n – 1) / r. A small epsilon of 0.0001 is added to the denominator to prevent division by zero when the growth rate is set to 0%. Subtracting the effective price premium gives the total net savings: S * ((pow(1 + annual_fuel_price_increase / 100, ownership_years) – 1) / (annual_fuel_price_increase / 100 + 0.0001)) – max(0, price_premium – tax_credit). When the fuel price increase is set to 0%, the epsilon causes a negligible rounding difference of less than $0.01 compared to the exact flat-rate result of S * n.
Worked Example
Example: Replacing a 28 MPG Sedan with a 50 MPG Hybrid
Suppose you currently drive a mid-size sedan rated at 28 MPG, drive 12,000 miles per year, and pay $3.50 per gallon. You are considering a hybrid rated at 50 MPG with a $4,000 price premium. You expect a $500 annual maintenance saving, no tax credit, plan to own the car for 7 years, and assume a 2% annual fuel price increase.
- Current annual fuel cost: (12,000 / 28) * 3.50 = 428.57 gallons * $3.50 = $1,500.00/year
- Hybrid annual fuel cost: (12,000 / 50) * 3.50 = 240 gallons * $3.50 = $840.00/year
- Year-1 fuel saving: $1,500.00 – $840.00 = $660.00
- Year-1 net annual savings: $660.00 + $500.00 maintenance saving = $1,160.00/year
- Effective price premium: max(0, $4,000 – $0) = $4,000.00
- Break-even period: $4,000 / $1,160 = 3.45 years
- Total net savings over 7 years (2% fuel price growth): $1,160 * ((1.02^7 – 1) / 0.0201) – $4,000 = $1,160 * (0.14869 / 0.0201) – $4,000 = $1,160 * 7.397 – $4,000 = $8,581 – $4,000 = $4,581 total net savings
In this scenario, the hybrid pays for itself in under 3.5 years and saves approximately $4,581 over 7 years of ownership — a strong financial case for switching.
How to Interpret the Results
Break-Even Period shorter than your ownership period: This is the key indicator that a hybrid makes financial sense for you. If your break-even is 4 years and you plan to own the car for 8 years, you will accumulate 4 full years of pure savings after the premium is recovered.
Total Net Savings is positive: A positive total net savings figure confirms the hybrid saves you money over your ownership window. The larger the positive number, the stronger the financial case. Values above $3,000–$5,000 represent a clear financial win for most buyers.
Total Net Savings is negative: A negative result means the price premium is not fully recovered within your ownership period. This does not necessarily mean the hybrid is a bad choice — you may value lower emissions, a smoother driving experience, or energy independence — but it does mean the financial case alone does not justify the switch within your timeframe. Consider extending your ownership period, negotiating a lower price premium, or seeking available incentives.
Very short break-even (under 2 years): This typically occurs when annual mileage is high, the MPG difference is large, or significant incentives are available. In these cases, the hybrid is almost certainly the financially superior choice.
Break-even longer than 8–10 years: This suggests the hybrid may not pay off financially unless you drive the vehicle for a very long time. Low annual mileage, a small MPG difference, or a large price premium are the most common causes. Try adjusting inputs to identify which factor has the greatest impact on your specific situation.
Common Mistakes to Avoid
- Using EPA best-case MPG instead of real-world MPG: EPA ratings are measured under controlled conditions. Real-world fuel economy is typically 10–20% lower, especially on highways. Using inflated MPG figures overstates your savings. Check owner forums and sites like Fuelly.com for real-world averages.
- Entering the full hybrid purchase price instead of the price premium: The calculator asks for the extra cost of the hybrid over a comparable conventional vehicle, not the total sticker price. Entering the full price will dramatically overstate your break-even period.
- Forgetting to include available incentives: Many buyers overlook state and local incentives on top of any federal credits. These can significantly reduce the effective price premium and shorten break-even time. Check your state’s energy office website before finalizing your inputs.
- Setting annual miles too low or too high: Using an unrealistic mileage figure skews all results. Check your actual odometer readings from the past 12 months rather than estimating from memory.
- Ignoring maintenance savings: Leaving the maintenance savings field at $0 understates the hybrid’s total financial benefit. Even a conservative $150–$200 per year adds up meaningfully over a 7–10 year ownership period.
- Assuming 0% fuel price increase for long ownership periods: Flat fuel prices are unlikely over 7–15 years. Using a modest 2–3% annual increase produces a more realistic long-term savings estimate.
Limitations and Important Notes
This calculator is an independent planning tool designed to provide general financial estimates. It is not affiliated with any vehicle manufacturer, government agency, or financial institution. Results are estimates based on the inputs you provide and the assumptions described below.
Key assumptions and limitations include:
- Fuel economy figures are assumed to reflect your actual real-world driving. EPA-rated MPG values may differ from real-world performance by 10–20% depending on driving style, climate, and terrain.
- The annual fuel price increase is applied as a compound growth rate. Actual fuel prices are volatile and may increase or decrease significantly in any given year.
- Maintenance savings are treated as a flat annual estimate. Actual savings vary by vehicle model, driving habits, service provider, and whether major repairs are needed.
- No depreciation differential between the hybrid and conventional vehicle is modeled. Hybrids may hold resale value differently, which is not captured here.
- The break-even formula uses flat Year-1 savings. The total net savings result uses compound escalation, which is more accurate for long-term projections.
- Tax credits and incentives are assumed to be fully available and applied at purchase. Eligibility depends on your income, the specific vehicle model, purchase date, and jurisdiction. Consult a tax professional or IRS.gov for current eligibility rules.
- Insurance cost differences between hybrid and conventional vehicles are not modeled.
- Plug-in hybrid (PHEV) electricity costs are not modeled. PHEVs have a separate electric driving component that this calculator does not account for.
- A small epsilon value of 0.0001 is added to the fuel price increase divisor to prevent mathematical division by zero when the increase is set to 0%.
Frequently Asked Questions
How long does it typically take for a hybrid car to pay for itself?
The break-even period for a hybrid depends on three main factors: the price premium over a comparable conventional vehicle, your annual mileage, and the MPG difference between the two vehicles. For an average U.S. driver covering 12,000–13,500 miles per year, a typical hybrid with a $3,000–$5,000 price premium and a 20–25 MPG advantage over a conventional car tends to break even in roughly 3–6 years. High-mileage drivers (18,000+ miles per year) can break even in as little as 2–3 years. Low-mileage drivers (under 8,000 miles per year) may take 7–10 years or longer. Use the calculator above to get a personalized estimate based on your specific situation.
Are hybrid cars cheaper to maintain than regular gasoline cars?
In most cases, yes — hybrids tend to have lower routine maintenance costs than comparable conventional vehicles. The primary savings come from two sources. First, many hybrids use synthetic oil and have longer oil change intervals, reducing the frequency and cost of oil changes. Second, regenerative braking — which captures kinetic energy to recharge the battery — significantly reduces wear on brake pads and rotors, meaning brake service is needed far less often. However, if a hybrid’s high-voltage battery pack needs replacement outside of warranty, the cost can be substantial (typically $2,000–$5,000 or more depending on the model). Most modern hybrid batteries are warranted for 8–10 years or 100,000 miles, and real-world data suggests they often last well beyond that.
Do hybrid cars save money if I don't drive many miles per year?
Hybrid savings are directly proportional to how much you drive. If you drive fewer than 7,000–8,000 miles per year, the annual fuel savings may be modest — potentially $300–$500 per year — which means a $4,000 price premium could take 8–12 years to recover. For low-mileage drivers, the financial case for a hybrid is weaker unless the price premium is very small, significant incentives are available, or you plan to own the vehicle for a very long time. That said, low-mileage drivers who do most of their driving in city stop-and-go traffic may see a proportionally larger MPG benefit from a hybrid, since hybrids excel in city conditions where regenerative braking is most effective.
What is the federal tax credit for hybrid vehicles in 2024?
As of 2024, the U.S. federal tax credit structure under the Inflation Reduction Act primarily targets plug-in electric vehicles (EVs) and plug-in hybrid electric vehicles (PHEVs) — not standard non-plug-in hybrids. Standard hybrids like the Toyota Prius (non-plug-in) or Honda Accord Hybrid generally do not qualify for the federal clean vehicle tax credit. Plug-in hybrids with sufficient battery capacity may qualify for credits up to $7,500 for new vehicles or $4,000 for used vehicles, subject to income limits, vehicle price caps, and North American assembly requirements. State and local incentives vary widely and may apply to standard hybrids in some jurisdictions. Always verify current eligibility at IRS.gov or with a qualified tax professional before making purchasing decisions.
How does rising fuel price affect my hybrid car savings?
Rising fuel prices amplify hybrid savings because the hybrid’s superior fuel economy means you buy fewer gallons — so every price increase affects you less than it affects the owner of a less efficient vehicle. For example, if gasoline rises from $3.50 to $4.50 per gallon, a driver covering 12,000 miles per year in a 28 MPG car pays $643 more annually, while the same driver in a 50 MPG hybrid pays only $360 more — a difference of $283 in additional savings per year just from that price increase. Over a 7–10 year ownership period with modest annual fuel price growth of 2–3%, the compounding effect can add hundreds or even thousands of dollars to your total net savings compared to a flat-price scenario.
Is a plug-in hybrid (PHEV) more cost-effective than a standard hybrid?
A plug-in hybrid (PHEV) can be more cost-effective than a standard hybrid for drivers who regularly charge the vehicle and do most of their driving within the electric-only range (typically 20–50 miles per charge for most PHEVs). In electric mode, the per-mile energy cost is significantly lower than gasoline, and PHEVs may qualify for federal and state tax credits that standard hybrids do not. However, PHEVs typically carry a higher price premium than standard hybrids, and their advantage diminishes for drivers who rarely charge or frequently take long highway trips beyond the electric range. This calculator models standard hybrid fuel savings only and does not account for PHEV electricity costs or charging behavior.
Do hybrid cars hold their resale value better than conventional cars?
Historically, popular hybrid models such as the Toyota Prius and Toyota Camry Hybrid have demonstrated strong resale values, partly due to consistent consumer demand and a reputation for reliability. However, resale value depends heavily on the specific model, brand, condition, mileage, and prevailing fuel prices at the time of sale — when gas prices are high, hybrid resale values tend to strengthen. It is worth noting that this calculator does not model resale value differences, as they are highly variable and difficult to predict. If you believe the hybrid you are considering holds its value better than the conventional alternative, your actual total financial benefit may be higher than the calculator’s estimate.
What MPG should I realistically expect from a hybrid in city versus highway driving?
One of the most distinctive characteristics of hybrid vehicles is that they often achieve better fuel economy in city driving than on the highway — the opposite of conventional gasoline cars. This is because regenerative braking, which recaptures energy during deceleration and braking, is most effective in stop-and-go city traffic. For example, a Toyota Prius rated at 57 MPG combined may achieve 54 MPG city and 50 MPG highway in real-world conditions. Conventional cars, by contrast, typically achieve 20–30% better fuel economy on the highway than in the city. If your driving is predominantly urban or suburban with frequent stops, your real-world hybrid MPG may actually exceed the EPA combined rating, making the savings even greater than the calculator’s estimate.