The CARM calculator helps you measure how an investment has grown on a compounded annual basis, giving you a single, comparable rate that smooths out year-to-year fluctuations. Enter your starting value, ending value, and the number of years held to instantly see your compound annual return metric, total percentage gain, and annualized return adjusted for a simple risk estimate. Whether you are evaluating a stock, fund, or portfolio, CARM provides a clear benchmark for comparing investments of different durations.
CARM Calculator: Estimate Compound Annual Return Metrics
Calculate your Compound Annual Return Metric (CARM/CAGR), total cumulative gain, net profit, and a simplified risk-adjusted return for any investment in seconds.
How to Use This Calculator

Follow these steps to get accurate results from the CARM calculator:
- Enter your beginning investment value — the amount you originally invested or the value of the asset at the start of the measurement period.
- Enter your ending investment value — the current or final value of the investment at the end of the period.
- Set the investment period in years — you can use decimals such as 2.5 for two and a half years or 0.25 for a single quarter.
- Optionally enter annual additional contributions — if you added money each year, this field gives you a realistic total capital deployed figure.
- Adjust the estimated annual volatility — use a percentage that reflects how much the investment typically fluctuates year to year (e.g., 15–20% for a diversified equity portfolio).
- Set the risk-free rate — use the current yield on a short-term government bond as a baseline (e.g., 4–5% in many markets as of recent years).
- Read your results — the calculator instantly displays your CARM/CAGR, total cumulative return, net gain in dollars, total capital invested, annualized excess return, and a simplified Sharpe-style ratio.
Understanding the Calculator Inputs
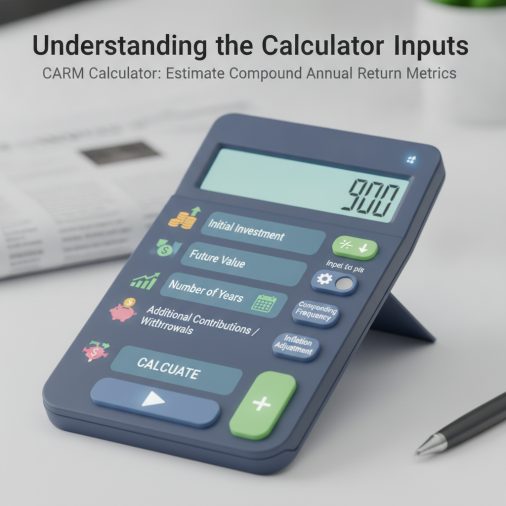
Beginning Investment Value ($): Enter the dollar amount you originally invested, or the market value of the asset at the exact start of your measurement window. This is the denominator base for all return calculations. For a stock purchase, use the total cost basis including any commissions if you want a more accurate net return. Minimum accepted value is $1.
Ending Investment Value ($): Enter the current or final market value of the investment at the end of the period. If the investment has been sold, use the net proceeds. If it is still held, use today’s market value. Do not include future projected values — this calculator measures realized or current performance only.
Investment Period (Years): Enter the number of years between your start and end dates. You may use decimals: for example, 18 months is 1.5, and 3 months is 0.25. The minimum is 0.25 years (one quarter) to avoid mathematical instability. Accuracy here is important — even a small error in the time period can meaningfully shift the annualized result.
Annual Additional Contributions ($): If you added a fixed amount each year during the holding period, enter it here. This field does not affect the CARM calculation itself but feeds the Total Capital Invested result, helping you understand how much of your ending value came from new money versus compounding. Leave at 0 if you made no additional contributions.
Estimated Annual Volatility / Std Dev (%): This is your best estimate of the investment’s annualized standard deviation of returns. Common reference points: broad equity index funds typically range from 12–18%, individual growth stocks from 25–50%, and bonds from 3–8%. You can find historical volatility figures on financial data platforms. This input is used only for the simplified risk-adjusted result.
Risk-Free Rate (%): Enter the annualized yield of a low-risk benchmark such as a 3-month or 10-year government treasury bond. This rate represents the return you could have earned with essentially no risk. As of recent years, rates in many developed markets have ranged from 3–5%. This value is subtracted from CARM to compute excess return and the Sharpe approximation.
Understanding Your Results
Compound Annual Return Metric (CARM / CAGR): This is the headline output — the constant annual growth rate that would transform your beginning value into your ending value over the specified period, assuming compounding. It is expressed as a percentage per year. A result of 8.45% means the investment grew as if it earned exactly 8.45% every single year, even if actual year-by-year returns varied widely.
Total Cumulative Return: This is the simple, non-annualized percentage gain or loss over the entire holding period. A $10,000 investment that grew to $15,000 has a 50% cumulative return regardless of how many years it took. Use this figure when you want to communicate the raw magnitude of growth without reference to time.
Total Net Gain / Loss ($): The absolute dollar profit or loss — ending value minus beginning value. This is the most intuitive measure of how much money you actually made or lost in currency terms. A positive number indicates a gain; a negative number indicates a loss.
Total Capital Invested ($): The sum of your initial investment plus all annual contributions multiplied by the number of years. This figure helps you contextualize how much of the ending value was funded by new deposits versus organic growth. Note that contributions are not compounded in this simplified model.
Annualized Excess Return: Your CARM minus the risk-free rate. This tells you how much additional annualized return you earned above what a risk-free instrument would have provided. A positive excess return means the investment outperformed the risk-free baseline; a negative value means it underperformed even a safe alternative.
Simplified Risk-Adjusted Return (Sharpe Approximation): Excess return divided by estimated annual volatility. This dimensionless ratio indicates how much return you received per unit of risk taken. As a rough guide: below 0.5 is considered weak, 0.5–1.0 is acceptable, 1.0–2.0 is good, and above 2.0 is excellent. This is an approximation and should not be cited as an official Sharpe ratio.
Calculation Formulas Explained
The core CARM formula is derived from the compound interest equation. If a beginning value BV grows to an ending value EV over n years, the compound annual growth rate is:
CARM = (EV / BV)^(1/n) – 1, expressed as a decimal, then multiplied by 100 for a percentage.
The exponent 1/n is the key: it takes the nth root of the total growth multiple, effectively reversing the compounding to find the equivalent constant annual rate. For example, if an investment doubled over 5 years, the growth multiple is 2.0, and the CARM is 2.0^(1/5) – 1 = 0.1487, or about 14.87% per year.
Total Cumulative Return is simply (EV – BV) / BV * 100 — the percentage change from start to finish with no time adjustment.
Total Net Gain is EV – BV — straightforward subtraction in dollar terms.
Total Capital Invested is BV + (contributions * years) — a linear sum of all money put in, without compounding the contributions.
Annualized Excess Return subtracts the risk-free rate from CARM: CARM% – risk_free_rate. This isolates the premium earned above a safe alternative.
Sharpe Approximation divides the excess return by the estimated annual standard deviation: (CARM% – risk_free_rate) / annual_std_dev. This follows the structure of the classic Sharpe ratio but uses CARM as the return estimate rather than a time-series average, making it a planning approximation rather than a statistically rigorous measure.
Worked Example
Scenario: An investor bought shares in a diversified equity fund for $20,000 five years ago. The portfolio is now worth $31,500. They contributed an additional $1,000 per year, estimate annual volatility at 16%, and use a risk-free rate of 4.5%.
- Beginning Value: $20,000
- Ending Value: $31,500
- Years: 5
- Annual Contributions: $1,000
- Annual Volatility: 16%
- Risk-Free Rate: 4.5%
Step 1 — CARM: (31500 / 20000)^(1/5) – 1 = 1.575^0.2 – 1 = 1.09511 – 1 = 0.09511, so 9.51% per year.
Step 2 — Total Cumulative Return: (31500 – 20000) / 20000 * 100 = 11500 / 20000 * 100 = 57.50%.
Step 3 — Net Gain: 31500 – 20000 = $11,500.
Step 4 — Total Capital Invested: 20000 + (1000 * 5) = $25,000. This shows that $6,500 of the $11,500 gain came from growth beyond new contributions.
Step 5 — Excess Return: 9.51% – 4.5% = 5.01% above the risk-free rate.
Step 6 — Sharpe Approximation: 5.01 / 16 = 0.313. This is below 0.5, suggesting the return per unit of risk was modest — though still positive and above the risk-free baseline.
How to Interpret the Results
When reading your CARM result, context matters enormously. As a general reference, the long-run average annual return of broad U.S. equity indices has historically been approximately 7–10% in real terms and 10–12% in nominal terms. A CARM above 10% for a diversified portfolio over a long period is generally considered strong; 5–10% is moderate; below 5% may lag inflation over time.
For individual stocks or sector funds, higher CARM values are more common but come with higher volatility — which is why the Sharpe approximation is useful. A stock returning 25% per year with a volatility of 60% may actually offer a worse risk-adjusted profile than an index fund returning 10% with 15% volatility.
A negative CARM means the investment lost value on an annualized basis. This is mathematically valid and will display as a negative percentage. A CARM of -5% means the investment shrank by roughly 5% per year on a compounded basis.
The excess return is particularly useful when comparing investments made in different interest-rate environments. An 8% CARM when the risk-free rate was 1% represents a much larger premium than the same 8% CARM when the risk-free rate was 6%.
The Sharpe approximation should be used directionally rather than as a precise figure. Use it to rank or compare two investments with similar time horizons, not to make absolute judgments about quality.
Common Mistakes to Avoid
- Using inconsistent time periods: Make sure your beginning and ending values correspond exactly to the start and end of the period you enter. Using a 3-year CARM with values that span 4 years will produce a misleadingly high result.
- Forgetting to include reinvested dividends: If your ending value does not reflect reinvested dividends or distributions, your CARM will understate the true total return. Use total return values (price appreciation plus income) for the most accurate picture.
- Confusing nominal and real returns: CARM does not automatically adjust for inflation. A 7% CARM in a 3% inflation environment represents only about 4% in real purchasing power terms. If you want a real CARM, use inflation-adjusted values.
- Entering projected future values: CARM is a measurement tool for realized or current performance. Entering a hoped-for future value produces a target growth rate, not a historical return — which is a different and speculative use case.
- Setting years to zero or a very small number: The formula divides by the number of years. A period of zero years is undefined, and very short periods (under 0.25 years) can produce extreme annualized figures that are not meaningful for comparison.
- Treating the Sharpe approximation as an official ratio: The simplified risk-adjusted result here uses CARM rather than a time-series mean return and may not match Sharpe ratios published by fund managers or data providers, which use different methodologies.
Limitations and Important Notes
This calculator assumes that no cash flows other than the optional annual contributions occur during the investment period. It does not model irregular contributions, withdrawals, or reinvestment timing. For investments with complex cash flow patterns, an Internal Rate of Return (IRR) calculation would be more appropriate.
The annual contributions field uses a simplified linear model — contributions are summed but not compounded. This means the Total Capital Invested figure is accurate, but the calculator does not compute a modified CARM that accounts for the timing of those contributions.
The volatility input is entirely user-supplied. The calculator cannot derive volatility from historical price data. If you use an inaccurate volatility estimate, the Sharpe approximation will be misleading. Always source volatility figures from reliable financial data providers.
All results are nominal and not adjusted for taxes, transaction costs, management fees, or inflation unless you manually adjust your input values to reflect these factors. After-fee and after-tax returns can differ substantially from gross figures.
This calculator is provided for educational and planning purposes only. It does not constitute financial advice, investment recommendations, or a guarantee of future performance. Past returns do not predict future results. Consult a qualified financial professional before making investment decisions.
Frequently Asked Questions
What does CARM stand for in finance?
CARM stands for Compound Annual Return Metric. It is a measure of the annualized growth rate of an investment over a specified period, assuming that gains are compounded — meaning returns are reinvested and generate their own returns over time. The term is closely related to, and mathematically equivalent to, the more widely used Compound Annual Growth Rate (CAGR). Both express the steady annual rate that would transform a beginning value into an ending value over a given number of years.
Is CARM the same as CAGR?
Yes, CARM and CAGR are mathematically identical. Both use the formula (Ending Value / Beginning Value)^(1/Years) – 1 to produce an annualized compounded growth rate. The difference is primarily one of terminology: CAGR is the more established and widely recognized term in finance and investment analysis, while CARM is sometimes used in specific analytical frameworks or educational contexts. When you see either term, you can apply the same formula and interpret the result in the same way.
What is a good CARM percentage for a stock portfolio?
A commonly cited benchmark is the long-run nominal return of broad equity market indices, which has historically averaged approximately 10–12% per year for U.S. large-cap stocks over multi-decade periods. A CARM above 10% over a long horizon is generally considered strong for a diversified portfolio. Returns of 5–10% are moderate and may still outpace inflation meaningfully. However, what counts as ‘good’ depends heavily on the risk taken, the time period, the asset class, and the prevailing interest rate environment. Always compare CARM against an appropriate benchmark index rather than an absolute number.
What happens to CARM if my ending value is lower than my beginning value?
If your ending value is less than your beginning value, the CARM will be a negative percentage, indicating an annualized loss. For example, if a $10,000 investment fell to $7,500 over 3 years, the CARM would be approximately -9.14% per year. The formula still works correctly in this scenario because the ratio of ending to beginning value is less than 1, and raising a number between 0 and 1 to a positive power still yields a number between 0 and 1, producing a negative result after subtracting 1. A negative CARM is a valid and informative output.
Does CARM account for dividends or distributions?
CARM only accounts for dividends and distributions if they are reflected in your ending value. If you are using a total return figure — one that includes the value of reinvested dividends — then yes, CARM captures that income. However, if your ending value represents only price appreciation and excludes dividends received, your CARM will understate the true total return. For the most accurate result, use the total return value of the investment (price change plus reinvested income) as your ending value. Many financial data platforms provide total return figures alongside price-only figures.
How does the investment period length affect CARM?
The investment period has a significant effect on CARM because it determines the exponent used in the formula. A shorter period amplifies both gains and losses when annualized — a 50% gain over 6 months annualizes to approximately 125%, which can be misleading as a long-term benchmark. Conversely, a very long period smooths out volatility and produces a more stable, representative figure. This is why CARM is most meaningful and comparable when calculated over periods of at least 3–5 years. Short-period CARM figures should be interpreted with caution and not extrapolated as expectations for future performance.
Can CARM be used for real estate investments?
Yes, CARM can be applied to real estate investments. You would use the original purchase price (or total acquisition cost) as the beginning value and the current market value or net sale proceeds as the ending value. For a more complete picture, you could add rental income received to the ending value to approximate a total return figure. Keep in mind that real estate involves transaction costs, maintenance expenses, financing costs, and tax implications that are not captured in a simple CARM calculation. For leveraged real estate, the CARM on equity (not total property value) will differ significantly from the CARM on the full asset value.
How does inflation affect my CARM result?
The CARM produced by this calculator is a nominal return — it does not automatically adjust for inflation. To find your real (inflation-adjusted) CARM, you can either adjust your input values to real terms before entering them, or apply the Fisher equation after the fact: Real CARM ≈ ((1 + Nominal CARM) / (1 + Inflation Rate)) – 1. For example, a nominal CARM of 8% during a period of 3% annual inflation corresponds to a real CARM of approximately 4.85%. Over long investment horizons, the difference between nominal and real returns is substantial and should always be considered when evaluating whether an investment preserved or grew purchasing power.